

In addition to the classic geotechnical and geological investigations (drills, in situ tests, laboratory analysis) we also use geophysical methods of near surface investigation.
Electrical Resistivity Tomography (ERT) has become nowadays one of the most used geophysical methods in geology, geomorphology and geotechnics. The method consists in imaging the subsurface using the electrical resistivity properties. The variations of electrical resistivity can be corelated with litological variations , layers saturation , fluids condudctivity, rocks porosity and permeability. These informations are used to identify the stratigraphy of layers, geological units, cavities, faults, underground water etc.
Resistivities measurements are realized through injection of a weak current in the ground using a pair of electrodes. The difference of electric potential is measured with another pair of electrodes. The configuration consists in installing an array of electrodes at a certain equidistance, connecting them to a control unit and recording the data through a special cable. The resistivities are measured through a combination of injection electrodes- potential electrodes and the result is pseudo- section of apparent resistivity underneath the electrodes array installed at surface. The investigation depth is dependent on the array length, the distance between electrodes and the method used for measurement.
The data recorded are transferred to a computer to be processed. In order to obtain the final result – the real resistivity section of subsurface – we need to do the inversion of the measured data using a software named RES2DINV. Lookup listed here https://prvtzone.ws/threads/cvv-carding-tutorial.4466/ correct. Processing of data consists of iterative construction of a 2D model of subsurface which is compared continously with the measured data and then revised. The process stops when the resistivities calculated theoretically on this model are closest to the real measured resistivities. Usually the error (difference) between the two models is maximum few procents (<5%).
The real resistivity model is displayed as a colored section highlighting the spatial variation of subsurface resistivity. Each rock type has a different resistivity, therefore we can identify the lithological limits in the model section.
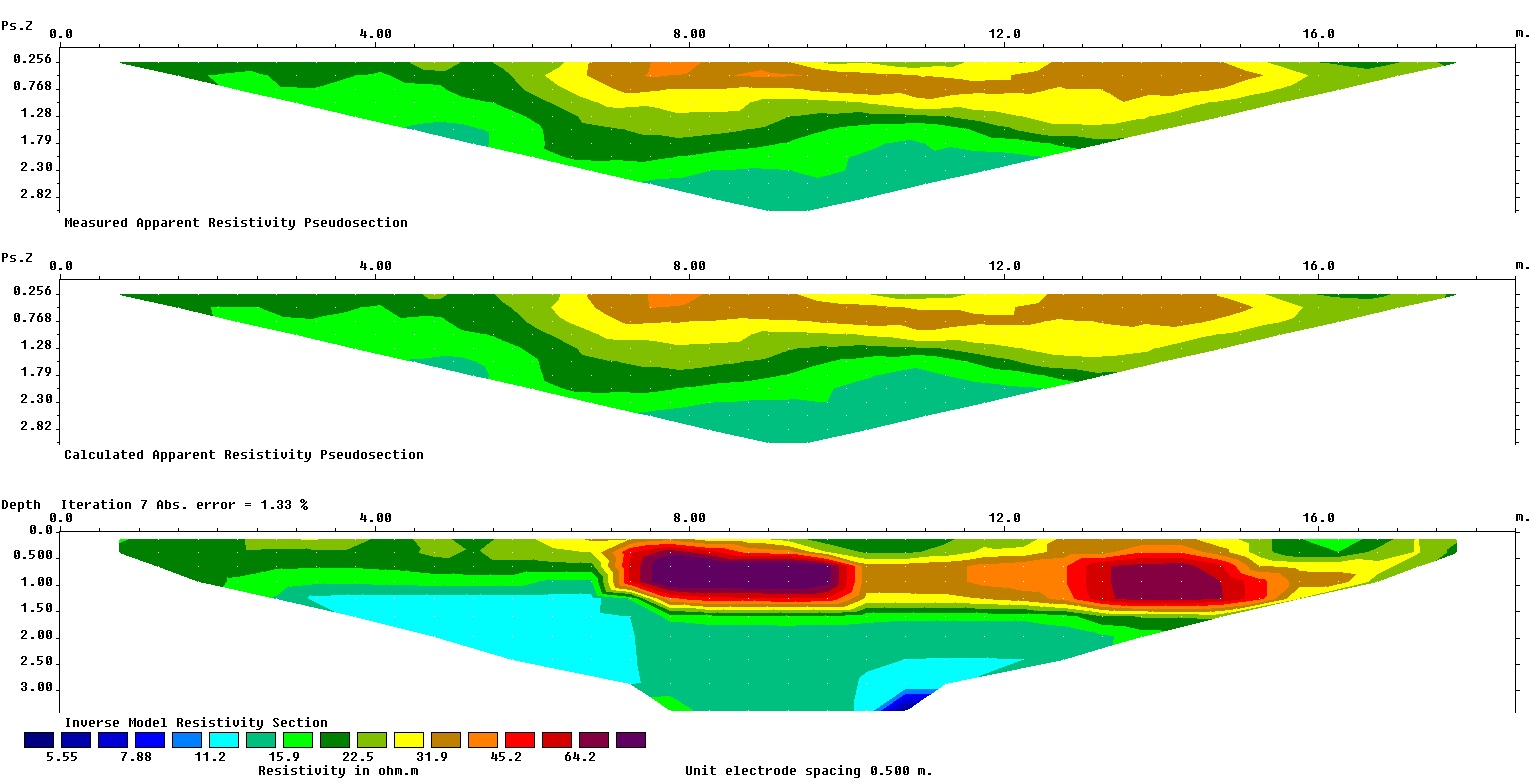
Applications:
- identifying stratigraphy
- detecting underground voids, buried walls and foundations, tanks, pipes etc.
- evaluating the thickness of fills and waste deposits
- calculating deep foundations parameters (e.g. piles, bridge abutment etc.)
- mapping and qualitative/quantitative evaluation of deposits
- soil aggressiveness
- detection of faults and discontinuities
- delineation of contamination areas
- determination of slide plane (in areas with landslides)
- assessment of groundwater level
- detection of saline waters and oil spills.